Market Overview
| Study Period | 2020 - 2031 |
|---|---|
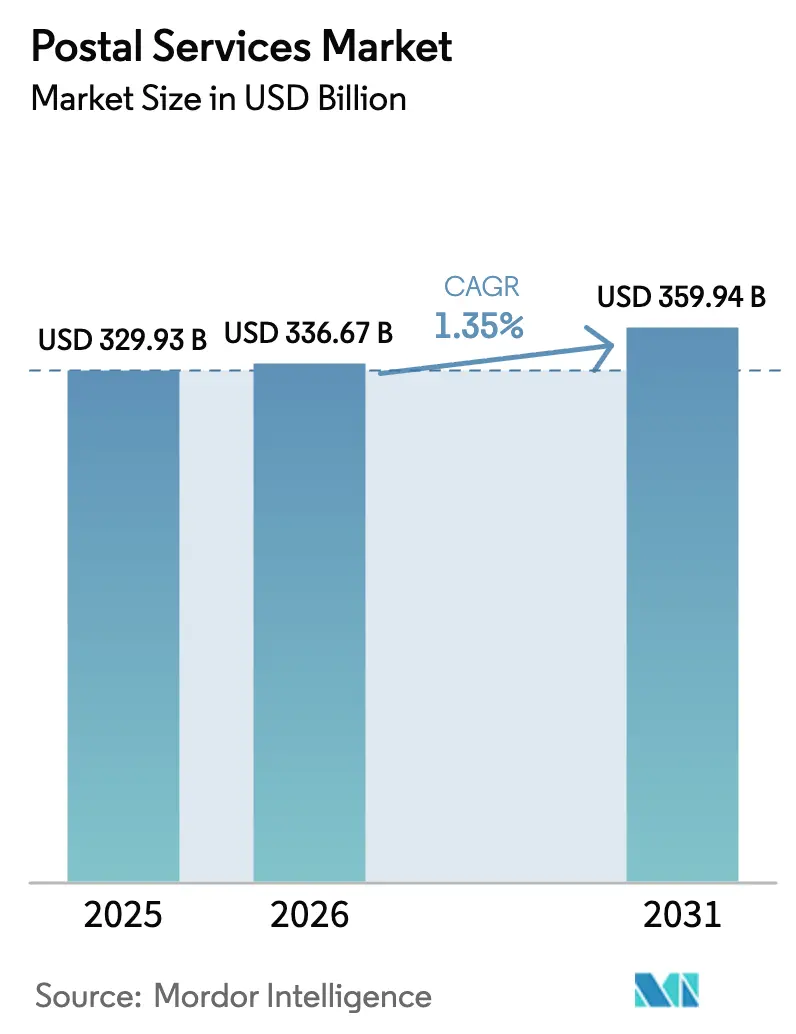
| Market Size (2026) | USD 336.67 Billion |
| Market Size (2031) | USD 359.94 Billion |
| Growth Rate (2026 - 2031) | 1.35% CAGR |
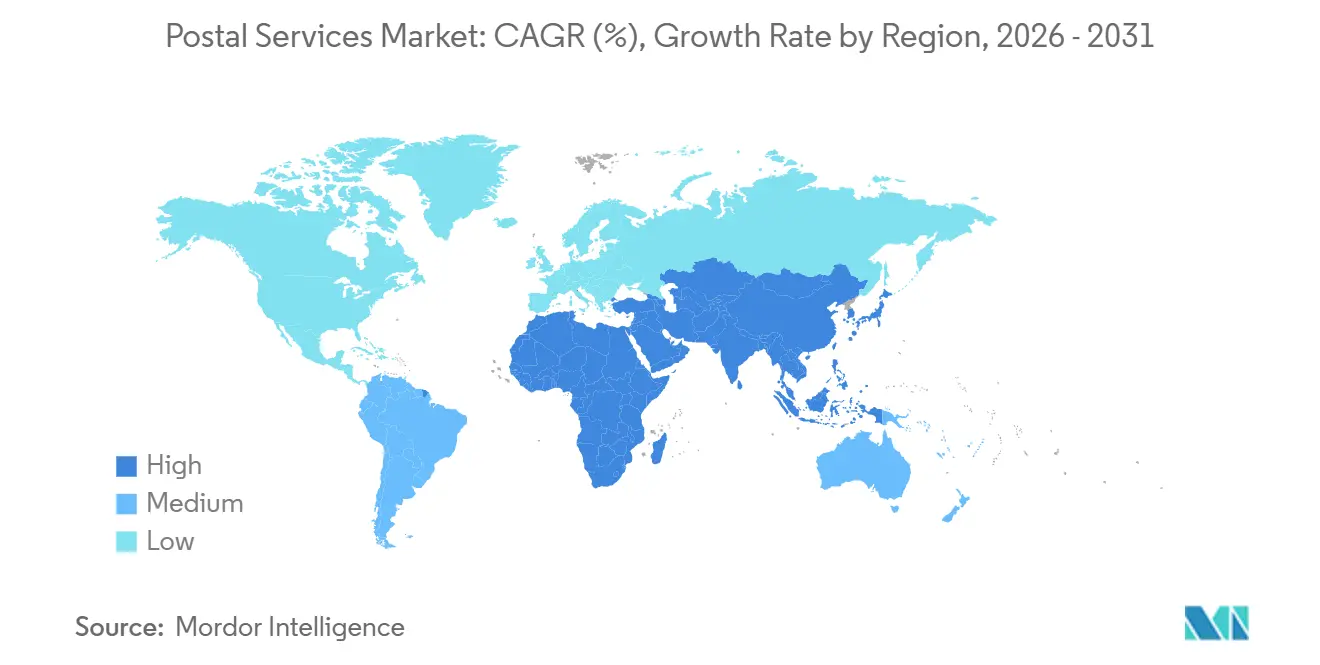
| Fastest Growing Market | Asia Pacific |
| Largest Market | Asia Pacific |
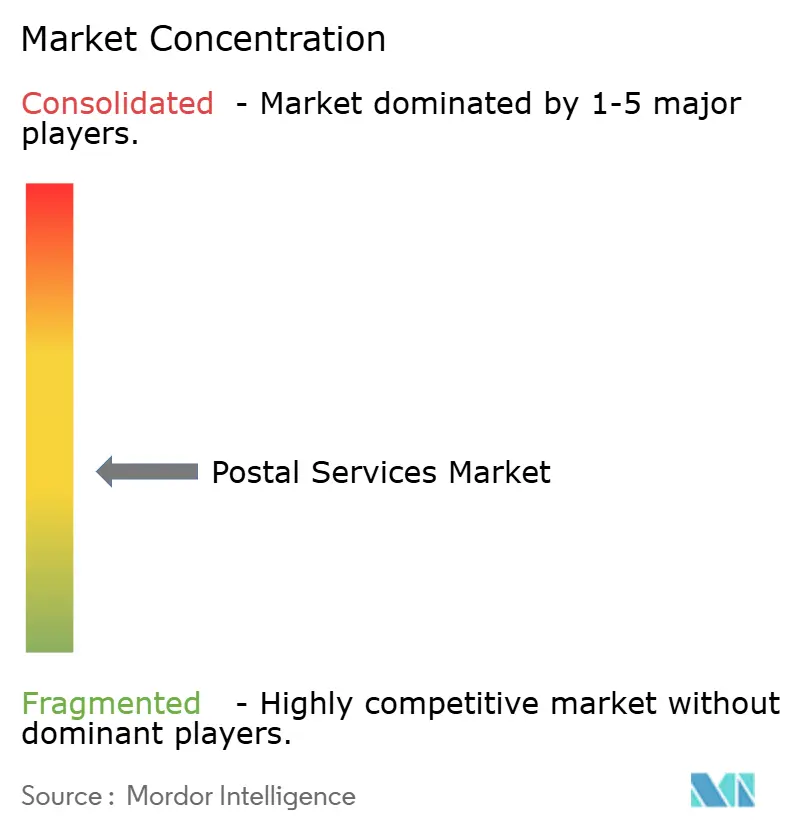
| Market Concentration | Medium |
Major Players *Disclaimer: Major Players sorted in no particular order Image © Mordor Intelligence. Reuse requires attribution under CC BY 4.0. | |
Postal Services Market Analysis by Mordor Intelligence
The Global postal services market size is expected to increase from USD 329.93 billion in 2025 to USD 336.67 billion in 2026 and reach USD 359.94 billion by 2031, growing at a CAGR of 1.35% over 2026-2031. Escalating demand for temperature-controlled healthcare logistics, accelerated customs clearance through digital platforms, and corporate ESG mandates that reward low-carbon delivery networks are steering operators toward premium parcel services and electric vehicle fleets. At the same time, blockchain-verified e-registered mail is gaining regulatory acceptance, strengthening the legal standing of cross-border contracts while reducing paper handling costs. Capital inflows into micro-fulfillment hubs are unlocking new revenue streams from underutilized urban post offices, yet volatile jet-fuel prices and cybersecurity compliance costs are eroding international express margins. Road transport retains dominance, but the revival of belly-hold air capacity and the proliferation of electric vans are reshaping the economics of last-mile delivery.
Key Report Takeaways
- By item, parcels held 59.49% of the Global postal services market share in 2025, while temperature-controlled healthcare parcels propelled the segment to a 2.90% CAGR through 2031.
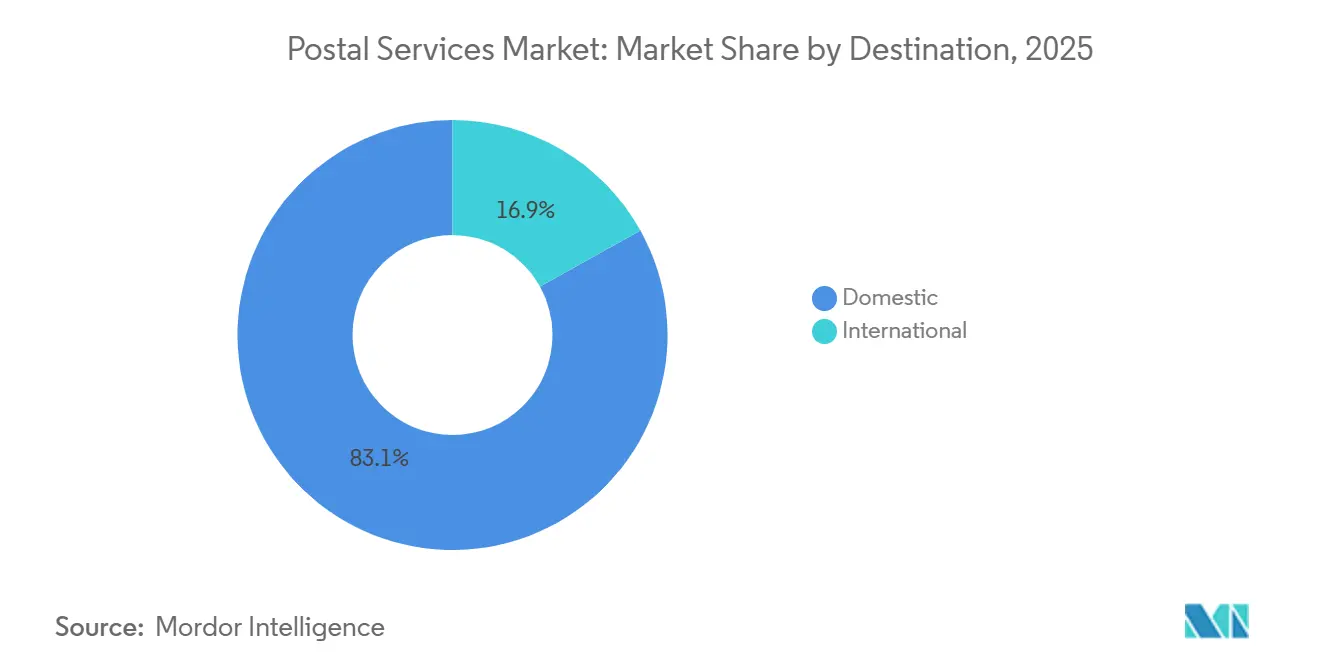
- By destination, domestic deliveries commanded 83.07% market share in 2025, while international shipments recorded the fastest expansion at a 3.65% CAGR over 2026-2031 as digital customs platforms trimmed border dwell times.
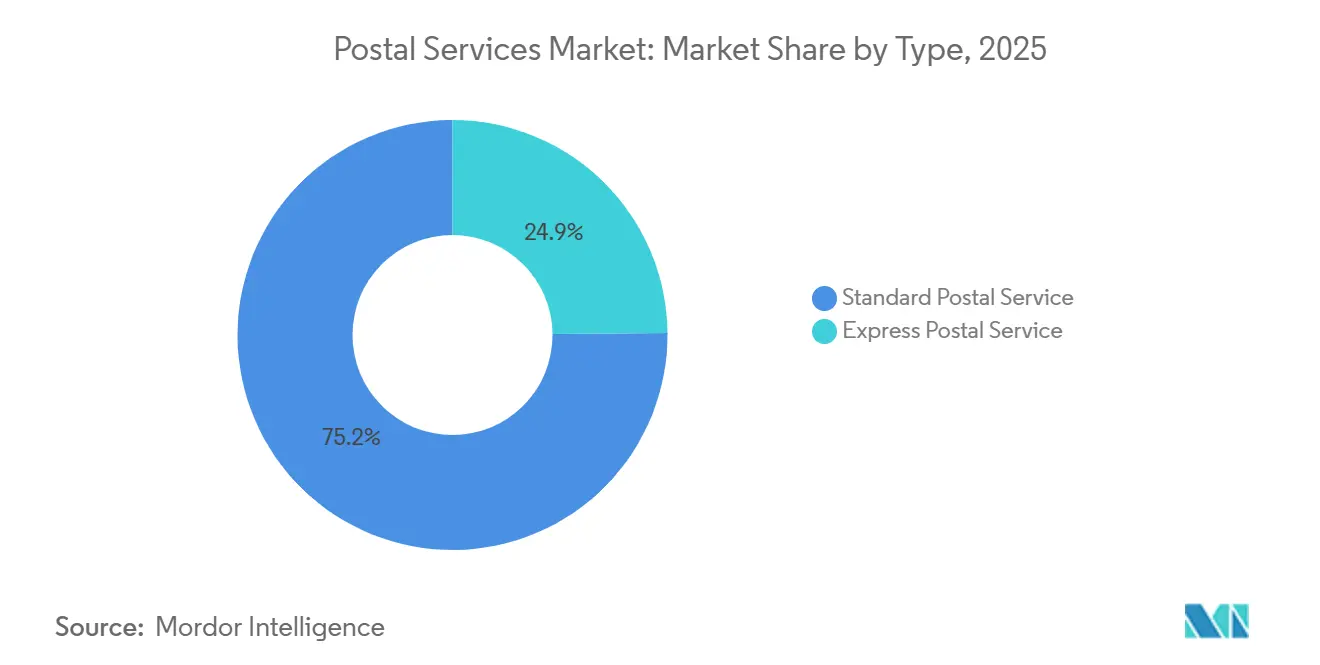
- By service type, standard postal services accounted for 75.15% of 2025 revenue, but express services advanced at a 3.91% CAGR to 2031 on rising demand for tracked, time-definite healthcare consignments.
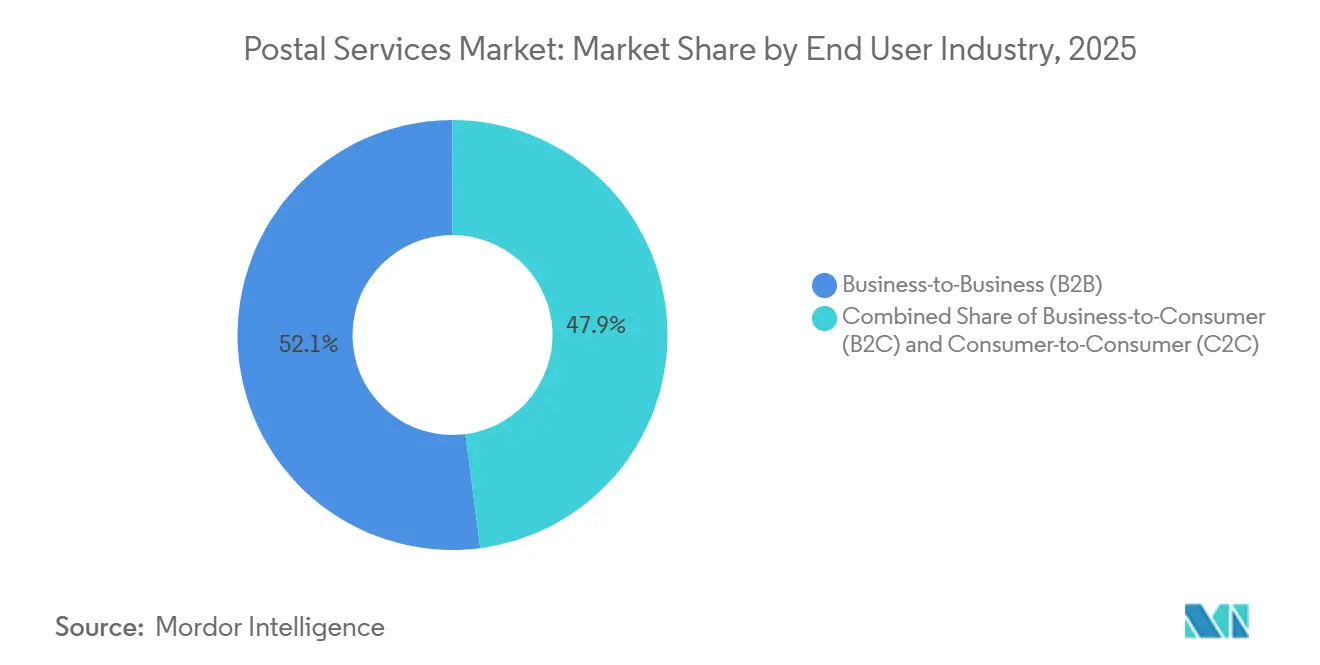
- By end-user, B2B retained 52.06% share in 2025, whereas B2C expanded at 4.33% CAGR, reflecting direct-to-consumer pharmaceutical distribution and subscription commerce growth.
- By delivery mode, road transport made up 74.93% of the 2025 value; air freight grew at 2.76% CAGR as operators pursued higher-yield international express volumes despite fuel-price volatility.
- By geography, Asia-Pacific accounted for 36.45% of the postal services market share in 2025, and is forecast to be the quickest-expanding region at a 3.51% CAGR through 2031.
Note: Market size and forecast figures in this report are generated using Mordor Intelligence’s proprietary estimation framework, updated with the latest available data and insights as of 2026.
Global Postal Services Market Trends and Insights
Drivers Impact Analysis*
| Driver | (~) % Impact on CAGR Forecast | Geographic Relevance | Impact Timeline |
|---|---|---|---|
| Carbon-neutral postal delivery mandated by corporate ESG scorecards | +0.20% | North America, Western Europe, developed Asia-Pacific | Medium term (2-4 years) |
| Digital customs platforms (EU ICS-2, US ACE 2.0) | +0.18% | EU, United States, spillover to ASEAN and GCC | Short term (≤ 2 years) |
| Growth in temperature-controlled healthcare parcels | +0.15% | Global, highest intensity in North America, EU, Japan | Medium term (2-4 years) |
| Rural broadband subsidies enabling e-government bundles | +0.12% | India, Brazil, Indonesia, rural US and Australia | Long term (≥ 4 years) |
| Blockchain-based e-registered mail adoption | +0.09% | Singapore, Switzerland, UAE with pilots in EU and North America | Long term (≥ 4 years) |
| Urban micro-fulfillment hubs in repurposed post offices | +0.08% | Dense urban centers worldwide | Medium term (2-4 years) |
| Source: Mordor Intelligence | |||
Understand The Key Trends Shaping This Market
Download Sample Report
Corporate-Shipper ESG Scorecards Mandating Carbon-Neutral Postal Delivery
Corporate procurement teams now embed carbon-reduction clauses into logistics contracts, obligating postal operators to electrify fleets, procure renewable energy, and publish ISO 14083-aligned emissions data or risk exclusion from high-volume tenders. Deutsche Post DHL allocated EUR 7 billion (USD 8.23 billion) to decarbonization through 2030, already fielding 37,000 electric delivery vehicles and sourcing 30% sustainable aviation fuel by end-2024. Walmart, Amazon, and Unilever require year-on-year carbon cuts from logistics partners, pushing laggards out of Fortune 500 bids as 68% of 2024 RFPs ranked ESG alignment among the top three selection criteria. The dynamic rewards operators that quantify emissions across every shipment leg and penalize those without transparent reporting frameworks. As a result, premium parcel rates increasingly bundle carbon-accounting certificates that shippers can apply toward Scope 3 disclosures[1]“Corporate Sustainability Reporting Directive,” European Commission, finance.ec.europa.eu.
Global Rollout of Digital Customs Platforms Accelerating Low-Value Parcel Clearance
The EU’s ICS-2 system, mandatory for postal operators since March 2024, demands pre-arrival electronic data, reducing compliant low-value parcel clearance times by up to 42%. Concurrently, United States, ACE 2.0 automates duty assessment for shipments under USD 800, saving operators as much as USD 1.20 per parcel in processing costs. Cross-border e-commerce parcels jumped 23% in 2024, overwhelming gateways that lacked automated risk screening. Early adopters such as PostNL and Swiss Post cut dwell times 18-22% and freed warehouse space for higher-margin express goods. Compliance, however, is capital-intensive, with mid-sized postal administrations investing USD 15-25 million in IT platforms and data-quality controls. Operators unable to meet the data-integrity thresholds face penalties, shipment delays, and customer churn[2]“Airline Industry Economic Performance,” International Air Transport Association, iata.org.
Boom in Temperature-Controlled Healthcare Parcels Needing Track-and-Trace Postal Solutions
Biosimilars, cell therapies, and mRNA vaccines rely on uninterrupted 2-8 °C corridors from plant to patient, pushing the value of healthcare cold-chain logistics to USD 21.3 billion in 2024. FedEx Healthcare Solutions expanded its GPS-enabled cold-chain fleet to 1,200 vehicles across 90 countries. UPS Healthcare added 47 GMP-compliant warehouses, offering validated passive packaging that sustains biologics for up to 120 hours. Postal operators lacking GDP accreditation or IoT temperature trackers are shut out of lucrative pharma bids, as shippers pay USD 18-32 per cold-chain parcel versus USD 6-9 for ambient freight. With aging populations and home-based care demanding doorstep delivery of biologics, cold-chain parcel volume is set for 8-11% CAGR through 2030, making healthcare a decisive battleground.
Rural Broadband Subsidies Enabling Bundled E-Government and Postal Digital Services
India’s BharatNet connected 640,000 villages with fiber by December 2024, allowing India Post to deliver digital payments and telemedicine from 155,000 rural post offices, yielding INR 12.4 billion (USD 149 million) in non-mail revenue. Brazil’s Correios generated BRL 890 million (USD 178 million) in transaction fees by bundling social-benefit disbursements at 5,200 rural branches. The USPS Rural Broadband Initiative pilots fiber along delivery routes in three U.S. states, with forecast wholesale bandwidth revenue of USD 200-300 million a year. While broadband lifts e-commerce adoption and, by extension, parcel volumes, 63% of global rural fiber projects still underperform financially within five years, underscoring the need for public-private partnerships and diversified revenue streams.
Restraints Impact Analysis*
| Restraint | (~) % Impact on CAGR Forecast | Geographic Relevance | Impact Timeline |
|---|---|---|---|
| Cyber-security compliance under NIS-2 and CISA | -0.20% | EU, United States, emerging in the United Kingdom, Canada, Australia | Short term (≤ 2 years) |
| Jet-fuel and bunker surcharge volatility | -0.15% | Global, highest on trans-Pacific and Europe-Asia lanes | Short term (≤ 2 years) |
| Extended Producer Responsibility packaging | -0.12% | EU, United Kingdom, pilots in California and Canada | Medium term (2-4 years) |
| Ad-mail budget migration to digital media | -0.09% | North America, Western Europe, developed Asia-Pacific | Long term (≥ 4 years) |
| Source: Mordor Intelligence | |||
Escalating Cyber-Security Compliance Spend under EU NIS-2 and CISA Mandates
The EU’s NIS-2 Directive classifies postal services as “essential entities,” prescribing 24-hour breach reporting and fines up to EUR 10 million (USD 11.76 million) or 2% of global revenue for non-compliance. In the United States, CISA requires multi-factor authentication and network segmentation by March 2025. Royal Mail Group invested GBP 47 million (USD 59 million) after a 2023 ransomware attack, yet industry surveys show 31% of postal workers still fail phishing simulations. Mid-sized operators must divert 4-7% of IT budgets to compliance, hiring expensive cyber-talent or outsourcing to managed-security providers, tightening free cash flow, and delaying automation projects[3]“NIS-2 Directive,” European Commission, digital-strategy.ec.europa.eu.
Volatile Jet-Fuel and Marine Bunker Surcharges Compress International Express Margins
Jet kerosene averaged USD 98 per barrel in 2024, 18% above 2023, while low-sulfur marine fuel ranged USD 650-720 per ton, widening cost-recovery lags for postal operators that adjust fuel surcharges quarterly. FedEx cited a 180-basis-point Express margin erosion in fiscal 2024 as surcharges trailed spot fuel costs. Hedging covers only 35-40% of exposure, leaving smaller operators vulnerable; some Caribbean posts suspended international express lanes during peak price spikes to avert 25% shipment-level losses[4]“Packaging and Packaging Waste Regulation,” European Commission, environment.ec.europa.eu.
*Our updated forecasts treat driver/restraint impacts as directional, not additive. The revised impact forecasts reflect baseline growth, mix effects, and variable interactions.
Geography Analysis
By End-User: B2C Surge Driven by Healthcare and Subscription Commerce
B2C will grow 4.33% CAGR, lifting its share above 50% by 2028, as direct-to-consumer pharma, fashion resales, and meal subscriptions proliferate. The segment’s premium on speed prompts investment in same-day micro-fulfillment hubs and AI route planners. Capgemini forecasts quick-commerce turnover of USD 266 billion by 2029, reinforcing parcel urgency. C2C shipments, propelled by recommerce platforms, add steady tailwinds at 3.2% CAGR, while B2B remains flat amid e-invoicing and digitized documentation. Operators counter B2B stagnation by layering supply-chain visibility dashboards and customs brokerage value-adds that capture service fees beyond postage.
Healthcare subscription programs enlarge the B2C share further. Pharmacies partner with posts to supply chronic-care medication kits, leveraging cold-chain nodes and providing recurring traffic that stabilizes daily volumes. Gig-economy rivals exert price pressure, but postal incumbents differentiate on nationwide coverage, secure chain of custody, and regulatory compliance.
Note: Segments share of all individual segments available upon report purchase
By Item: Parcel Dominance Masks Letter Mail Erosion
Parcels owned 59.49% of 2025 volume and will grow 2.90% CAGR as e-commerce penetration nears 25% of global retail by 2031. Within parcels, healthcare and fresh groceries set the fastest trajectory, each above 8% CAGR, as home-based care and meal-kit adoption rise. Automated sortation investment reached USD 994.94 million in 2024 and is projected at USD 1.55 billion by 2031, driving throughput and traceability. Letters, now 40.51% of items handled, decline 1.8% annually due to digital invoices, with volumes increasingly skewed to recipients aged 50+. Blockchain e-registered mail could displace up to 20% of certified letters by 2030, accelerating contraction. The Global postal services market size for letters still exceeds USD 140 billion, but profitability hinges on cost restructuring and bundling with digital identity services.
Although the letters segment shrinks, legal and government requirements sustain a baseline. Operators monetize address databases for identity verification and leverage delivery confirmation networks for voter-ballot programs. In emerging markets, gap-filled rural broadband triggers incremental statement mail for micro-finance providers. Nonetheless, without dynamic pricing or cost-sharing models, letters’ contribution to the Global postal services market will diminish steadily.
By Destination: International Flows Accelerate Despite Customs Friction
Domestic shipments held 83.07% of 2025 spend, yet international parcels will outpace at 3.65% CAGR through 2031 as shoppers source products globally. The Global postal services market size tied to international deliveries is forecast at USD 64 billion by 2031, even with new tariffs such as the United States 34% levy on Chinese imports BBC. Digital customs advances like ICS-2 shorten clearance, enhancing reliability. However, fuel surcharges and geopolitical shocks introduce volatility; operators with diversified hubs and broker services absorb shocks better. Duty-paid options, expanded by DHL Express, simplify consumer experience and build loyalty among SMB exporters.
Domestic networks still drive scale economies, especially in populous countries. Rural broadband grants in India and Brazil raise domestic parcel density, improving route productivity. Yet urban congestion charges and low-emission zones strain cost structures, intensifying the shift toward consolidated locker deliveries and bicycle couriers.
Note: Segment shares of all individual segments available upon report purchase
By Type: Express Services Capture Premium Healthcare Demand
Express services represented 24.85% of 2025 revenue yet are forecast to expand at a 3.91% CAGR, nearly triple standard services’ 1.12% pace, as shippers favor guaranteed delivery and IoT-enabled tracking. The Global postal services market size attributable to express services is projected to reach USD 89.4 billion by 2031, buoyed by biosimilar launches and direct-to-patient programs. Temperature-controlled consignments command surcharges, lifting per-parcel yield and offsetting higher aviation fuel costs. Operators retrofit aircraft with active containers and embed GPS sensors, generating granular data that satisfies pharma compliance audits. Standard services remain crucial for bulk mail and low-urgency parcels but suffer from automated letter substitution and relaxed universal service obligations. Automation upgrades, such as Deutsche Post’s AI sorters, trim labor expense, sustaining profitability even as volumes wane.
Standard services held 75.15% of the Global postal services market share in 2025, anchored by government correspondence and low-cost parcel delivery. However, shifts in regulatory frameworks Denmark ended its letter USO in 2024 signal mounting pressure to realign prices with cost. Growth pockets exist in hybrid mail, where printed statements are triggered from cloud-based platforms, offering financial institutions a compliant fallback as cyber breaches rise. Yet without diversified value-added logistics, standard-centric operators risk margin compression amid EPR and cybersecurity cost inflation.
By Delivery Mode: Air Freight Gains Despite Fuel Volatility
Road retained 74.93% value in 2025, yet air cargo expands 2.76% CAGR, benefiting from restocked belly-hold capacity as passenger traffic rebounds. Boeing delivered only 14 777F freighters in 2024, so constrained supply lifts charter yields BOEING. The Global postal services market share of air freight remains below 15%, but healthcare cold-chain and cross-continental e-commerce rely on its speed. Operators mitigate fuel exposure via hybrid networks flying priority SKUs while routing non-urgent parcels by sea or rail. China Railway Express ran 17,000 China-Europe trains in 2024, carrying 1.9 million TEU, an emerging option for mid-speed, low-carbon delivery. Electric vans deployed for road legs cut per-parcel CO₂ by 24%, aligning with shipper ESG scorecards.
Sea freight widens margin where delivery windows exceed 10 days. The IMO sulfur cap tacks USD 22 per TEU, but unit costs remain one-twentieth of air, appealing to mass-market apparel shippers. Rail’s resilience amid Red Sea disruptions drew postal operators to invest in Eurasian land bridges, diversifying risk. Combined modes underpin adaptive networks that weather fuel and geopolitical shocks.
Segment Analysis
Asia-Pacific remains the growth engine, expanding 3.51% CAGR, and a commanding Global postal services market share at 36.45% in 2025. Vietnam’s postal revenue doubled between 2019 and 2023 to VND 59 trillion (USD 2.3 billion) as parcels soared to 2.5 billion items. India Post’s RFID-equipped Nodal Delivery Centres heighten traceability, while China Post’s USD 2.5 billion joint venture with Cainiao deploys 40 hubs across Belt-and-Road corridors. Japan Post’s USD 1.2 billion stake in Toll Group expands its Oceania footprint. Yet heterogenous GST thresholds and customs regimes multiply compliance workloads; operators must tailor IT systems market by market. Electrified two-wheeler fleets proliferate for dense urban routes, slashing cost per stop by 18%.
North America contributed roughly 28% of Global postal services market revenue in 2025. The USPS’s Delivering for America 2.0 pursues USD 36 billion in savings over 10 years, yet a USD 9.5 billion fiscal-2024 deficit spurs privatization debates. CISA compliance imposes USD 12-18 million in cyber outlays on mid-tier operators. Canada Post targets parcel-sorting automation and Shopify alliances to stem 8.2% annual letter declines. Rural broadband pilots in Alaska and Montana promise wholesale bandwidth rents that diversify revenue, illustrating how infrastructure policy intersects with postal modernization. Express healthcare parcels lift revenue density, but air-fuel surcharges pressure margins.
Europe represented nearly 26% share. Denmark’s 2024 abolition of the letter USO signals liberalization momentum, while the EU’s NIS-2 and EPR rules tighten operational discipline. Deutsche Post’s AI sorters slash labor by 28%, enhancing competitiveness worth emulating across La Poste and Royal Mail networks. EPR fees add EUR 0.08-0.15 per kilogram of packaging, totaling an extra EUR 180-280 million (USD 211.73-329.36 million) annually. Micro-fulfillment conversions of 340 French post offices enable same-day delivery for e-commerce platforms, countering declining ad-mail. Cross-border parcel volumes benefit from streamlined ICS-2, yet fuel volatility and Brexit-related customs complexity continue to cloud express margins.
Note: Segment shares of all individual segments available upon report purchase
Competitive Landscape
The Global postal services market features moderate concentration: the 10 largest operators captured about 52% of 2025 revenue, down from 58% in 2020 as platform-owned networks and regional specialists seized share. Deutsche Post DHL garners 68% of its EUR 84.2 billion (USD 99.04 billion) from logistics segments beyond mail, evidencing diversification imperatives. Amazon Logistics handles 27% of the United States parcels, crowding incumbent express lanes. Technology investment dictates advantage; Royal Mail allocated GBP 47 million (USD 63.40 million) to cybersecurity upgrades after ransomware exposure, while Singapore Post is piloting autonomous robots with Grab in high-density estates.
Strategic M&A reshapes sector dynamics. DHL’s March 2025 acquisition of CRYOPDP deepens its biopharma reach, while Japan Post’s USD 1.2 billion Toll Group stake extends Asia-Pacific logistics. UPS’s USD 1.8 billion MNX deal strengthens cold-chain assets, signaling healthcare as the next revenue pillar. EPR and NIS-2 compliance costs may catalyze consolidation as mid-sized EU posts seek scale to absorb regulatory overheads. Operators also monetize real estate: La Poste’s micro-fulfillment hubs unlock rent plus same-day fees, balancing eroding letter margins.
White-space opportunities include rural logistics 34% of population yet only 18% of parcels and reverse logistics for the 16.5% online return rate. Leaders deploy AI route optimization to cut miles per stop and blockchain smart contracts to guarantee cross-border document integrity. Market entrants face rising barriers; cybersecurity mandates and cold-chain accreditation require upfront capital beyond reach of many startups, reinforcing incumbents’ strategic edge.
Postal Services Industry Leaders
United States Postal Services
Japan Post
DHL Group
La Poste Group
International Distribution Services
- *Disclaimer: Major Players sorted in no particular order
Need More Details on Market Players and Competitors?
Download Sample Report
Recent Industry Developments
- March 2025: DHL Group acquired CRYOPDP, adding specialty biopharma capabilities across 15 countries.
- February 2025: Japan Post Holdings closed its USD 1.2 billion purchase of a 51% stake in Toll Group’s Australian logistics arm, expanding trans-Pacific e-commerce flow.
- November 2024: Royal Mail and Evri agreed to share rural delivery networks, targeting a 15% cost reduction while retaining separate brands.
- October 2024: FedEx acquired ShipBob’s European fulfillment sites for USD 750 million, adding 25 centers across four countries.
Research Methodology Framework and Report Scope
Market Definitions and Key Coverage
Our study defines the postal services market as public or private operations that collect, sort, move, and deliver addressed letters and parcels under 31.5 kg through standard or express networks on domestic and international routes. Revenue covers service fees from B2B, B2C, and C2C senders.
Scope Exclusion: Heavy freight, pallet loads, and insurance products handled at post offices are out of scope.
Segmentation Overview
- By Type
- Standard Postal Services
- Express Postal Services
- By Item
- Letters
- Parcels
- By Destination
- Domestic
- International
- By End-User
- Business-to-Business (B2B)
- Business-to-Consumer (B2C)
- Consumer-to-Consumer (C2C)
- By Delivery Mode
- Road
- Air
- Sea
- Rail
- By Geography
- North America
- United States
- Canada
- Mexico
- South America
- Brazil
- Peru
- Chile
- Argentina
- Rest of South America
- Asia-Pacific
- India
- China
- Japan
- Australia
- South Korea
- South East Asia (Singapore, Malaysia, Thailand, Indonesia, Vietnam, and Philippines)
- Rest of Asia-Pacific
- Europe
- United Kingdom
- Germany
- France
- Spain
- Italy
- BENELUX (Belgium, Netherlands, and Luxembourg)
- NORDICS (Denmark, Finland, Iceland, Norway, and Sweden)
- Rest of Europe
- Middle East and Africa
- United Arab of Emirates
- Saudi Arabia
- South Africa
- Nigeria
- Rest of Middle East and Africa
- North America
Detailed Research Methodology and Data Validation
Primary Research
Interviews with postal regulators, union leaders, major e-retail shippers, and logistics integrators confirmed tariff moves, parcel-mix shifts, and automation uptake, closing desk-research gaps.
Desk Research
We began with Universal Postal Union accounts, Eurostat transport tables, International Post Corporation metrics, and national regulator filings that anchor operator revenue and volume. UNCTAD e-commerce and World Bank logistics series supplied cross-border context.
Our analysts mined D&B Hoovers, Dow Jones Factiva, and Questel patent scans for company and technology insights. Annual reports and investor decks refined segment definitions. The sources named are illustrative; many others informed validation.
Market-Sizing & Forecasting
Mordor's model starts with a top-down rebuild of national postal revenue from UPU filings, adjusted for currency shifts and non-postal income, and is checked against bottom-up samples of average price multiplied by parcel volume. Core variables, GDP per capita, online retail sales, letter-to-parcel switch rate, international weight mix, and postage indices shape the 2025 baseline. Multivariate regression with scenario overlays tests sensitivity and corrects outliers.
Data Validation & Update Cycle
Our analysts run variance scans against Pitney Bowes parcel indices and peer macro signals, then convene internal review. The model refreshes yearly, with interim updates after major regulatory or pricing events.
Why Mordor's Postal Services Baseline Deserves Decision Maker Confidence
Estimates often diverge because firms use different service scopes, weight limits, and refresh cycles.
By tying our scope to universal-service rules and realigning with the latest operator disclosures, Mordor analysts reduce hidden definition drift. Elsewhere, warehousing is folded into postal revenue, parcel growth is overstated, and currency rates are frozen; our annual refresh and mixed-method checks temper those distortions.
Benchmark comparison
| Market Size | Anonymized source | Primary gap driver |
|---|---|---|
| $584.99 B (2025) | Mordor Intelligence | - |
| $248.06 B (2024) | Global Consultancy A | Excludes express cross-border parcels |
| $252.93 B (2025) | Industry Journal B | Relies on letter decline only |
| $235.60 B (2024) | Regional Consultancy C | Counts government operators only |
These comparisons show our transparent baseline rests on clear variables and repeatable steps, giving decision makers a dependable reference for strategy and investment.
Need A Different Region or Segment?
Customize Now
Key Questions Answered in the Report
What CAGR is projected for the Global postal services market between 2026 and 2031?
The market is forecast to post a 1.35% CAGR from 2026 to 2031, reaching USD 359.94 billion by the end of the period.
Which segment is expanding fastest within postal services?
Express postal services, fueled by temperature-controlled healthcare demand, are growing at 3.91% CAGR through 2031.
How are ESG requirements shaping postal operator strategy?
Corporate ESG scorecards push operators to electrify fleets and adopt carbon reporting, leading to significant investment in renewable energy and low-emission delivery.
Why are digital customs platforms important for cross-border parcels?
Systems like EU ICS-2 and United States ACE 2.0 cut low-value parcel clearance times by up to 42%, improving delivery speed and reducing handling costs.
What challenges do postal operators face in cybersecurity?
Compliance with the EU NIS-2 Directive and U.S. CISA directives requires substantial spending on multi-factor authentication, incident reporting, and SOC staffing, straining budgets, especially for mid-sized operators.

